Switching from Cygwin to MSysGit – Git Thinks Everything Has Been Modified :-(

Introduction

I’ve been dabbling with git lately, contributing to the Nancy project, and I’ve been happily working away using Cygwin, which I already had installed, and all was fine and dandy. Things went slightly awry, however, when I decided to give MSysGit a whirl. Typing “git status” on my (unmodified) repository, that I’d previously used with Cygwin, showed every single file as modified.. argh!

Faking FileModes

A quick “git diff” showed this output for every file:

old mode 100755
new mode 100644

A brief Google later and it turns out that MSysGit “fakes” filemodes (unix permissions – the 755/644 part of the log above), whereas Cygwin, which is a more “complete” Linux implementation on Windows, does them “properly”. Now, by default, git tracks the filemode and considers it a change whenever it’s modified, so the “fake” modes coming back from MSysGit were making everything appear modified.

Solution

Luckily, the solution is very simple – tell git to stop tracking filemodes! I set this as a global option, but also had to set it on the repository too as it has a default value set in there. The following two commands sorted it out:

git config --global core.filemode false
git config core.filemode false

Conclusion

A simple fix to a, potentially, obscure problem; but I think if you’re using msysgit to work on non-Windows projects, that may have filemodes set for executable scripts, then this workaround may be required too. Apparently MSysGit does attempt to fake the filemode based on file extension, so things that *look* like they should be executable are faked to have +x, but it’s not going to be perfect.

Why is Add Reference Still Horribly Broken in VS2010?

Introduction

We all know Add Reference is horribly broken in VS2008. We’ve all clicked it and had our hearts sink as we realised it was time to make a brew, grab lunch or take a weekend mini-break before even attempting to use Visual Studio again. Now VS2010 is in Release Candidate it’s obviously been fixed.. hasn’t it?!

Not All Change Is For the Better

The main issue with the VS2008 Add Reference dialog was that it took an age to load, mostly due to it enumerating all of the assemblies available to populate the .NET tab. If all  you wanted to do was add a project or file reference you still had to wait for it to finish building the .NET tab. Not good. In an attempt to fix the problem Microsoft has made two major changes to the dialog for VS2010:

  • The dialog now defaults to the Projects tab.
  • The .NET tab is now multi-threaded i.e. it loads types in the background.

The first of the two fixes is an excellent idea. If you want to use the Projects, Browse or Recent tabs then you don’t even need to look at that snail-paced .NET tab.

The second of the two fixes is horrible. Truly horrible. I’d even go as far as to say that if you actually want to use the .NET tab to add a reference then it’s actually *more broken than Visual Studio 2008*. Yes, I did say that. And I’ll say it again:

“If you actually want to use the .NET tab to add a reference then it’s actually more broken than Visual Studio 2008.”

To illustrate the point, lets say we want to add MEF, which sits in System.ComponentModel.Composition to our application, we’d probably do something similar to the following:

  1. Click Add Reference.
  2. Marvel at how quickly Add Reference Loaded.
  3. Click the .NET tab.
  4. Watch the first few items start to load up.
  5. Type “Sys” to jump down to System in the list.
  6. Go to select System.ComponentModel.Compo..oh no.. it’s moved.
  7. Scroll down, go to select Sys.. nope.. it’s moved again.
  8. Scroll down a bit more, click on.. nope, gone again.
  9. Swear.
  10. Wait until the thing has fully finished loading and then select what we want.

So what we have there is the same delay as it would have taken with VS2008, but with the added “fun” of playing a game of “chase the reference down the listbox” in a vain attempt to save yourself a few seconds.

Could It Be Done Better?

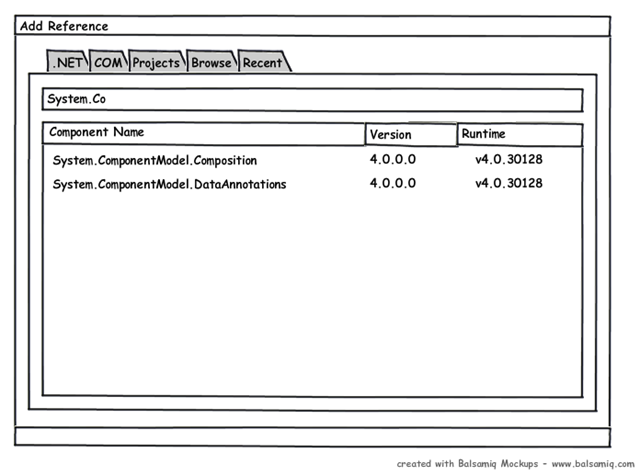
Now I’m no User Experience expert, or an Interface Designer with a fancy job title, but couldn’t this be improved immeasurably with a simple filter box?

Perhaps I work in a strange way, but I never start searching for a reference using the mouse – I *always* type the first few letters to skip to roughly where I want to go. If we had a simple filter box at the top of the dialog then the “chase the reference” game would be massively reduced, and probably eliminated all together if you’d typed in enough of the namespace name:

AddReference

Now we could get super fancy and support CamelCaseSearching like the QuickNav dialog in CodeRush, but I’d be quite happy with a basic filter.

Maybe I’m just picky.

Automated “Unit” Testing – It’s Not Just for TDD, It’s for Bug Fixing Too!

Disclaimer – What I’m discussing here isn’t unit testing (hence the quotes), it’s more functional or integration testing; but as the term “Unit Testing” is often “abused” to mean “anything that uses a (unit) testing framework” so I’ve included it in the title to avoid confusion.

Introduction

I’m currently using TinyIoC in my first forays into MonoTouch development, and my initialisation code was throwing a resolution error on starup:

var container = TinyIoCContainer.Current();
var mainView = new MainView();
container.Register<IViewManager>(mainView);
container.Register<IView, MainView>(mainView, "MainView");
container.Register<IView, SplashView>("SplashView").UsingConstructor(() => new SplashView());
container.Resolve<IView>("MainView");
container.Register<IStateManager, StateManager>();
// Code was blowing up here..
var stateManager = container.Resolve<IStateManager>();
stateManager.Init();

The Exception that was given was that IStateManager could not be resolved, which was odd given that the StateManager was registered against IStateManager, and everything in its constructor was also registered:

public StateManager(IViewManager viewManager, Func<string, IView> viewFactory)

To The Debugger.. Right?!

So at this point your immediate reaction may be to fire up the debugger, trace into the code and start hacking around, debugging and hacking around some more until it works. Sure, that’s an approach, and one I’m sure we’ve all used in the past; but as I was pretty sure the issue was in TinyIoC itself I took a slightly different tack.

To The Test Runner!

With the approach above I would have to build and run my app every time I wanted to check if my “fix” had actually worked – and even if it had, how would I know it hadn’t broken something else? The solution is quite simple – recreate the conditions of the bug in a unit test, using stubs/mocks to replace your real classes, and make sure it fails in the same way:

[TestMethod]
public void Dependency_Hierarchy_With_Named_Factories_Resolves_All_Correctly()
{
    var container = UtilityMethods.GetContainer();
    var mainView = new MainView();
    container.Register<IViewManager>(mainView);
    container.Register<IView, MainView>(mainView, "MainView");
    container.Register<IView, SplashView>("SplashView").UsingConstructor(() => new SplashView());
    container.Resolve<IView>("MainView");
    container.Register<IStateManager, StateManager>();
    var stateManager = container.Resolve<IStateManager>();
    stateManager.Init();

    Assert.IsInstanceOfType(mainView.LoadedView, typeof(SplashView));
}

I’ve added an Assert to show what behaviour I think it *should* have. It’s a pretty horrible looking test, but it accurately represents what my failing code was doing, and the test fails as I expected it to. Now I can attach the debugger and find out what’s going on, safe in the knowledge I have a fast executing test available to verify my fix, and the rest of my test suite there to ensure I haven’t broken anything else.

After a very brief investigation it turned out that there was a bug in registration when *just* an Interface type was registered with an concrete instance (the IViewManager registration above). The “InstanceFactory” it was using hadn’t set the “AssumeResolves” flag, so TinyIoC was actually trying to find a valid constructor for IViewManager – which obviously wasn’t going to succeed. It’s a scenario I probably should have factored into my Unit Tests, but hey, nobody is perfect 🙂

Conclusion

This post is aimed at covering two points:

  1. Test aren’t just for TDD. If you find a bug, isolate it with a test and you have a quick and easy way to verify a fix, and verify you haven’t broken anything else.
  2. Code Coverage isn’t everything. Apart from a few “defensive coding” null checks, the core of TinyIoC has pretty much 100% code coverage with its tests, but it didn’t help me with this issue. Although the code path was covered, the exact input (Interface type, concrete instance) wasn’t in my unit tests, so don’t assume 100% code coverage means 0 bugs in the code, there may well be a scenario you missed!

System.OutOfMemoryException Gotcha Using Clipboard.GetData in WPF

Introduction

Consider the following simple class for managing storage and retrieval of custom classes in the Windows Clipboard using WPF:

using System;
using System.Windows;

namespace ClipboardTest.Services
{
    public class ClipboardService : IClipboardService
    {
        public bool ContainsData<T>() where T:class
        {
            return Clipboard.ContainsData(typeof(T).ToString());
        }

        public void SetData<T>(T data) where T:class
        {
            Clipboard.SetData(typeof(T).ToString(), data);
        }

        public T GetData<T>() where T : class
        {
            return Clipboard.GetData(typeof(T).ToString()) as T;
        }
    }
}

Simple stuff, but it lets me abstract the clipboard away and remove the usual “magic string” approach for clipboard types.

Now consider the following basic tests:

using ClipboardTest.Services;
using Microsoft.VisualStudio.TestTools.UnitTesting;

namespace ClipboardTest.Test.Services
{
    public class TestPayload
    {
        public string Data { get; set; }
    }

    [TestClass]
    public class ClipboardServiceTests
    {
        [TestMethod]
        public void SetData_CustomClass_ClipboardContainsInstanceOfClass()
        {
            string data = @"More Cowbell";
            var clipboardService = new ClipboardService();

            clipboardService.SetData<TestPayload>(new TestPayload() { Data = data });

            Assert.IsTrue(clipboardService.ContainsData<TestPayload>());
        }

        [TestMethod]
        public void SetDataGetData_CustomClass_ReturnsEquivilantClass()
        {
            string data = @"More Cowbell";
            var clipboardService = new ClipboardService();

            clipboardService.SetData<TestPayload>(new TestPayload() { Data = data });
            var output = clipboardService.GetData<TestPayload>();

            Assert.IsNotNull(output);
            Assert.AreEqual(data, output.Data);
        }
    }
}

Again, all very simple. The first test checks to make sure that the class gets stored onto the clipboard, and the second checks to see if the class we get back off the clipboard is the same as the one we put in.

The more astute among you have probably spotted the problem in the test code already, but the resultant symptoms are a little confusing.

System.OutOfMemoryException?

When we run the tests the first test runs absolutely fine, but the second test crashes out with a System.OutOfMemoryException. A bit more digging showed that storing and retrieving standard types such as strings, ints etc all worked fine, but my own class was throwing an exception.

Checking good old MSDN threw up the following statement:

An object must be serializable for it to be put on the Clipboard.

Seeing as I had stupidly forgotten to add the SerializableAttribute to the TestPayload class that definitely explained why things weren’t working as I expected; but it didn’t really explain the actual behaviour I was seeing. Another quote from MSDN, but from the WinForms documentation, stated:

If you pass a non-serializable object to a Clipboard method, the method will fail without throwing an exception.

So from that I would expect SetData to silently fail, and for nothing to be on the clipboard. However the first test above clearly shows that the clipboard at least thinks that something of our specified type has been added to the clipboard – it just throws an exception when we try and retrieve it again. Marking the payload class as serializable did fix the issue, but the behaviour I was seeing certainly didn’t make that obvious!

Just out of interest I tested the same code using the WinForms Clipboard class, which looks to all intents and purposes exactly the same as the WPF one, and that did fail silently and returned null from GetData.

Conclusion

So, after all that rambling, the conclusion is that if you are working with the Clipboard in WPF and you are getting System.OutOfMemoryExceptions that don’t seem to make any sense, then you’ve probably forgotten to add the SerializableAttribute to whatever class you placed on the Clipboard.

Sync Live Writer Local Drafts Across Multiple Machines with DropBox

Introduction

Anyone that blogs should be using Live Writer, end of discussion. It’s brilliant in its own right (and surprisingly doesn’t just support Windows Live blogs!) and its various plugins just make life so much better for bloggers.

One of the features it has, which I’ve always found a little limiting, is the ability to save local drafts. These drafts are saved into your local Documents folder, which is fine if you blog from a single machine, but if you chop and change machines as often as you change your socks like I do, then it’s not a whole lot of use. Admittedly it does give you the option of saving drafts to your blog (with WordPress at least), but I don’t particularly want ALL my inane nonsense cluttering my blog drafts 🙂

Asking The Question

I asked Joe Cheng, one of the Live Writer developers, on Twitter about whether changing the default location was possible. Unfortunately it’s one of those features that’s “on the list” for the next major version, but not implemented this release. Jason Burns was kind enough to point out a solution using Live Mesh, which works a treat; but DropBox is my “cloud storage of choice”, and one of the first things I install on any machine, so I hacked together my own solution.

The Solution / Workaround / Bodge

One of features of NTFS, which isn’t widely used, is the ability to create “junction points”. Junction Points are very similar to symbolic links in the UNIX world – they create a file or folder that “maps” to another file or folder; so when I go to c:\myfakefolder I can actually be looking at files in c:\myrealfolder. They’re not used all that often because Shortcuts generally do a good enough job for linking one place to another; but in this scenario Shortcuts don’t cut the mustard (Live Writer will just ignore it and create its folder again), so a junction point it is!

First things first we need to copy or create the “My Weblog Posts” directory in our Dropbox, which you can just do with Explorer, then delete the original from our Document folder. You might want to back it up in case this goes horribly wrong 🙂

Next we need to create our junction point, which is easy in Vista and Win7, as they both come with utilities to manage them, but for XP or Windows 2000 you will have to download a SysInternals utility called Junction from Technet. The syntax for the two methods is slightly different, but the basic concept is the same. We tell the utility the location of the link we want to create (which will be <your documents directory>\My Weblog Posts) and where to point it to (which will be <your dropbox directory>\My Weblog Posts). E.g.:

Vista / Win7

mklink /D "%UserProfile%\Documents\My Weblog Posts" "%UserProfile%\Documents\My Dropbox\My Weblog Posts"


WinXP / Win2k

junction "%UserProfile%\My Documents\My Weblog Posts" "%UserProfile%\My Documents\My Dropbox\My Weblog Posts"

And that should be that. If you copied existing drafts to your Dropbox you should be able to see them from the Open dialog. There does appear to be a small bug in Live Writer whereby it doesn’t show you the drafts in the shortcut list on the right hand side until you’ve actually saved a draft; but you can access them just fine from the Open menu, and they’ll magically appear once you’ve saved a draft for the first time.

I worked on this post using this workaround on two different machines, so it does seem to work nicely; but as with all workarounds, please make sure you back everything up just in case!

*Update*

If you don’t want to type these commands in manually then Will Charles has created a useful little GUI utility to take some of the pain away. You can grab it over on his blog.